1. Overview
Dashboard is the first page after signing in. Administrators (with the depot:read permission) see the whole installation; everyone else sees their own spaces, what's new in them and their access (see Your dashboard below). The greeting follows the time of day on your own computer.
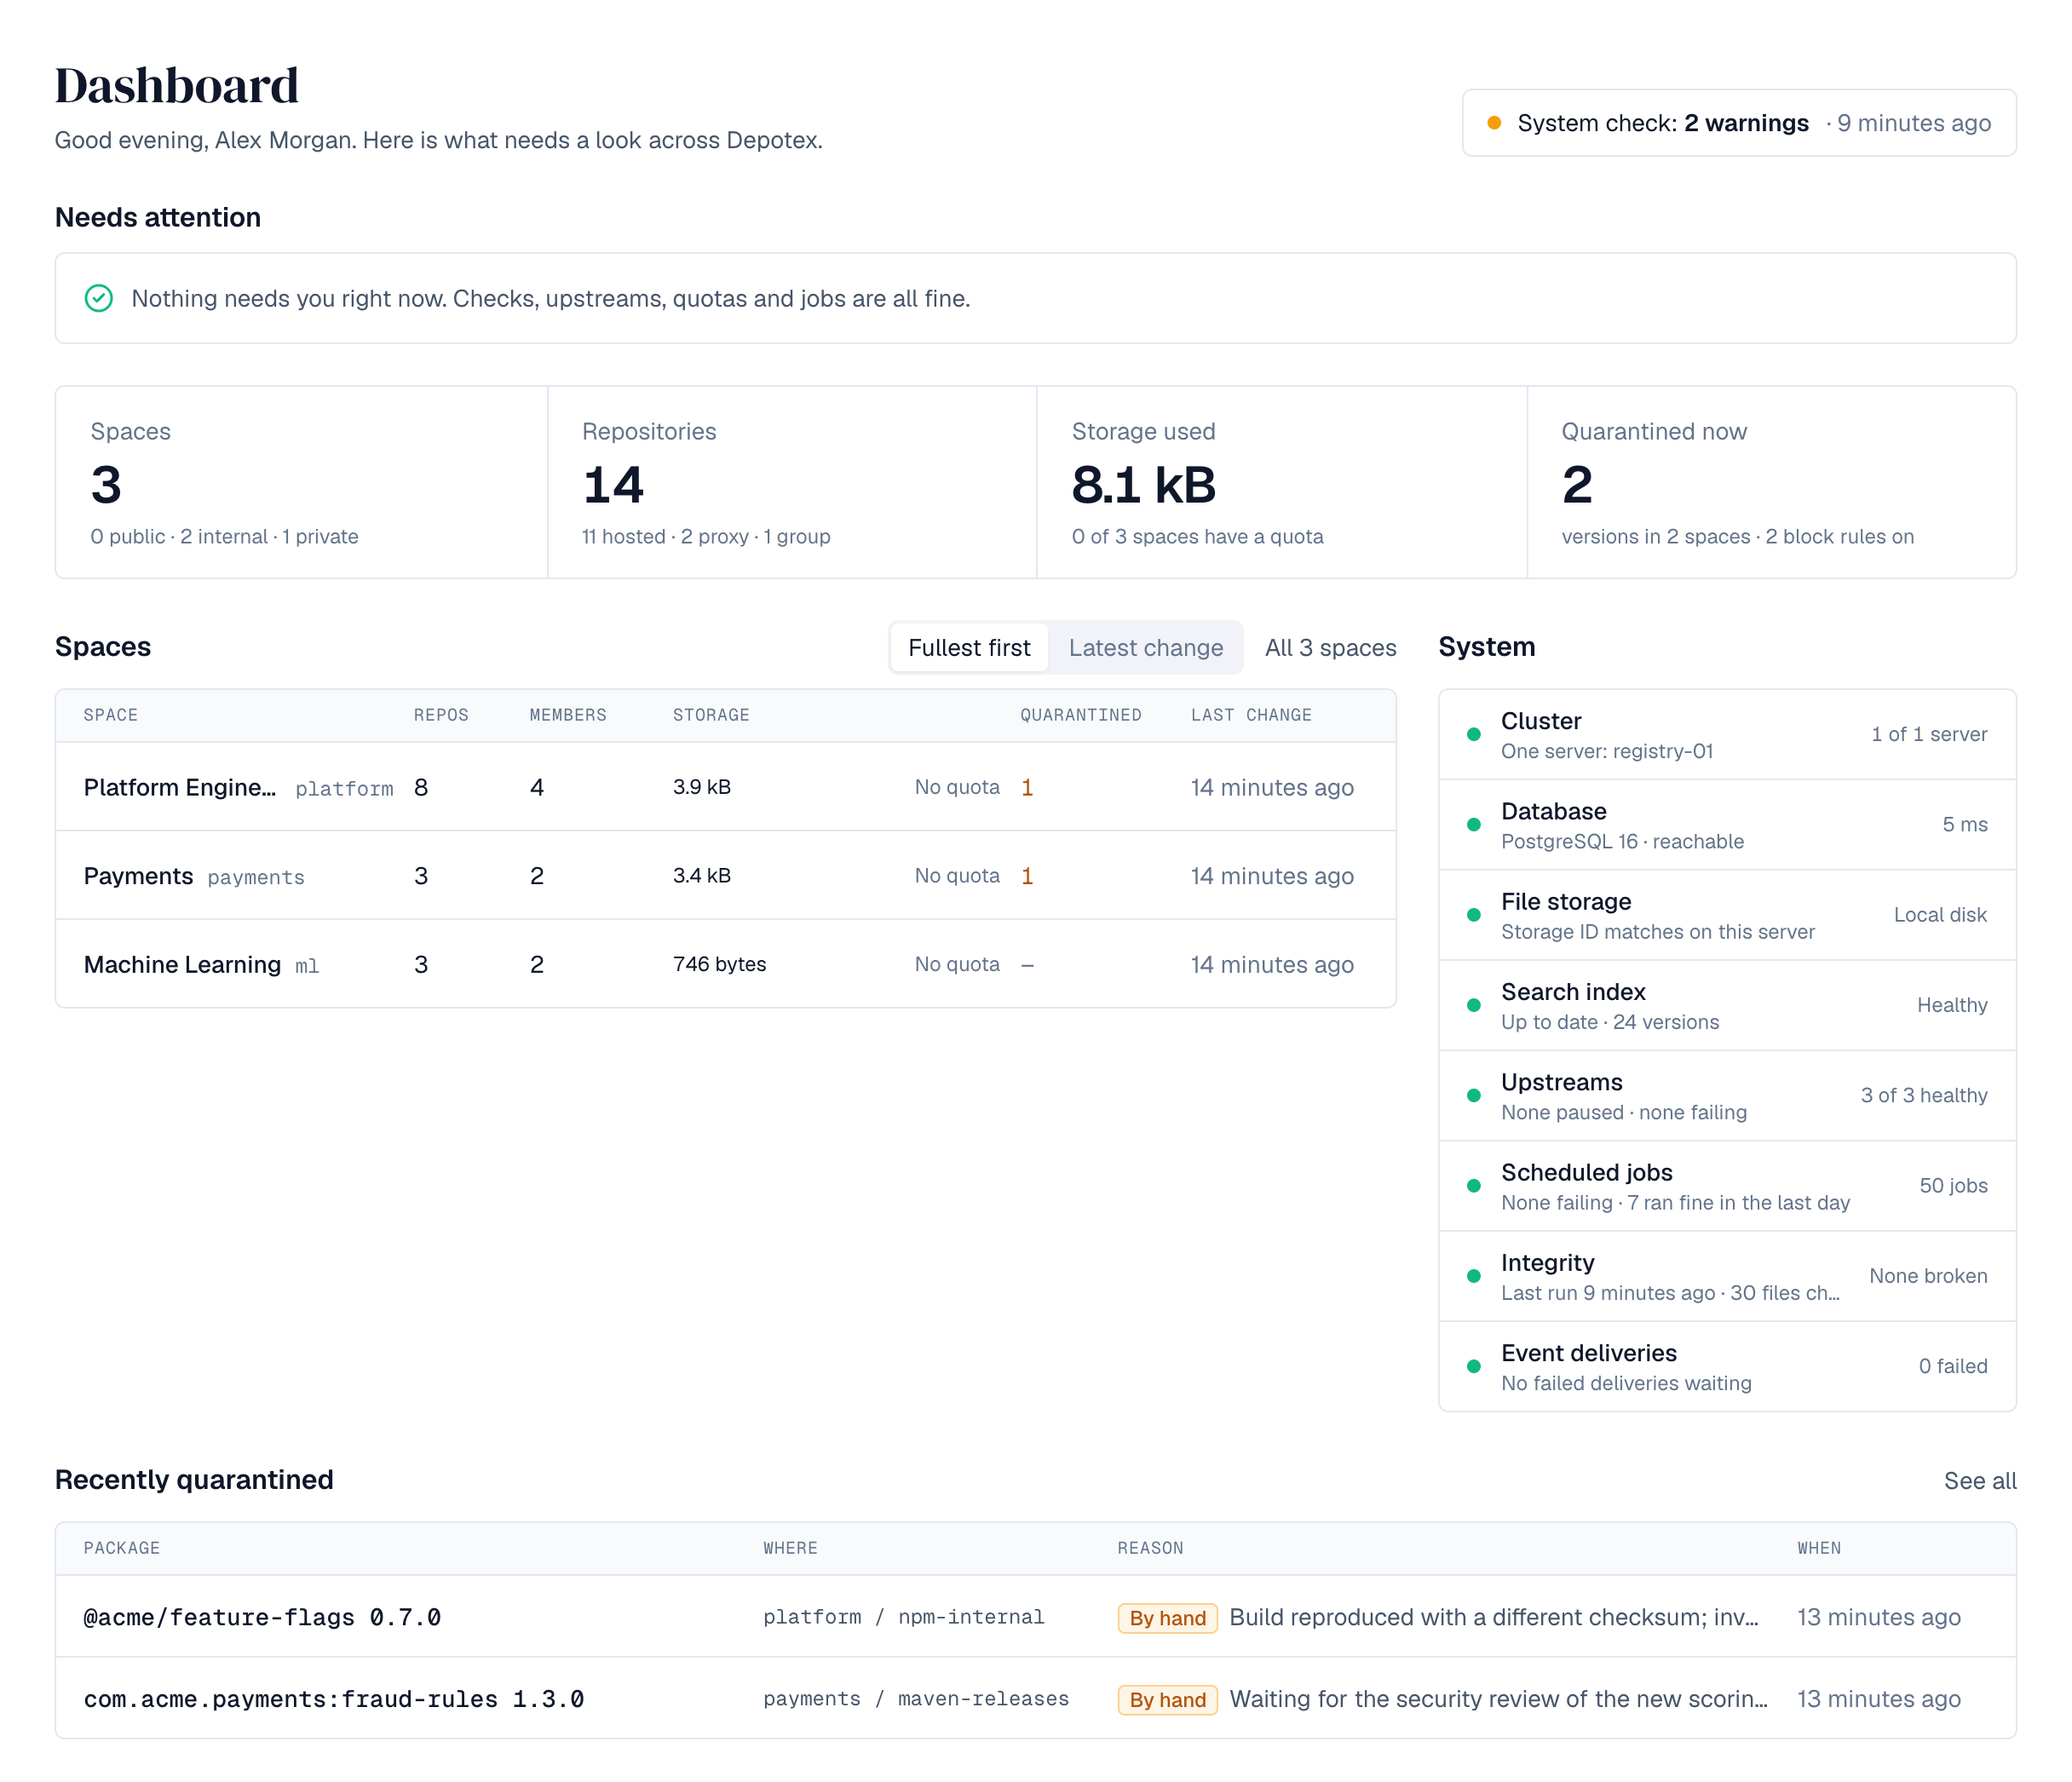
Every part of the page shows only what you're allowed to open: a row or link for something you have no permission for is left out rather than shown and refused. Figures are at most 30 seconds old.
2. Needs attention
The list at the top is what someone should look at now, worst first, each with a button to where it's fixed. When nothing needs you, it says so. For administrators it can hold:
| Item | Shown to | Button |
|---|---|---|
| An upstream is paused after repeated failures, failing (including when only the host its files come from fails), or failed in the last 15 minutes though it has answered since, with how many proxy repositories use it | upstreams:read | Opens the upstream |
| Broken files in storage found by the integrity check | integrity:admin | Opens Integrity |
| A space is past its quota's warning, or full | depot:read | Opens the space's quota |
| A scheduled job failed three times in a row | scheduler:read | Opens Scheduled jobs |
| The license expires within 45 days, has expired or isn't valid | licenses:admin | Opens Licensing |
Members see versions held in quarantine in their spaces (with Review when they may release them, View versions otherwise), their own API tokens that expire within a week (the button opens the tokens in your profile settings), and spaces they own that are nearly full.
3. Your dashboard
Without administrator rights the dashboard is about you. Browse packages at the top opens Browse.
- Your spaces: a card for each space you're a member of (up to eight; All spaces lists every space you can see), with your role, how many repositories it has and how many versions are quarantined, its storage against the quota, and when something last changed. Browse opens Browse showing only that space. A space where you can use only some repositories is marked Limited, with how many you can see.
- New in your spaces: the six newest versions in your spaces, with their repository, downloads and when they were published; a quarantined, blocked or broken version is marked. See more in Browse opens Browse.
- Your access: your active API tokens and how many expire within a week, your signed-in sessions (both open your profile settings), the upstreams your spaces fetch from, naming any that can't be reached, and your groups.
4. Figures
Four figures sum up the installation: Spaces (public, internal and private), Repositories (hosted, proxy, group, and how many are offline), Storage used (and how many spaces have a quota) and Quarantined now (versions held, in how many spaces, and how many block rules are on). Select one to open where it's managed. Blocked versions aren't counted: whether a version is blocked is decided when someone downloads it.
5. Spaces
The six fullest spaces (share of their quota), or the six with the latest change: switch with Fullest first and Latest change. Each row shows repositories, members, storage against the quota (amber from the quota's warning, red when full), versions quarantined and when something last changed. All spaces opens the full list. On a phone each space is a card.
6. System
One row per part of the installation, with a coloured dot (green fine, amber needs a look, red a problem, grey not checked yet) and a link to where it's managed:
| Row | Shows | Permission |
|---|---|---|
| Cluster | Servers running, the leader, and servers that stopped or are behind on heartbeats | cluster:read |
| Database | Reachable, its PostgreSQL version and how fast it answered | settings:write |
| File storage | Where files are stored, and whether the storage ID check passed on the server that answered | storage:admin |
| Search index | Up to date, rebuilding or behind, and how many versions it holds | depot:read |
| Upstreams | How many are healthy, paused or failing | upstreams:read |
| Scheduled jobs | How many jobs, how many are failing and how many ran fine in the last day | scheduler:read |
| Integrity | Broken files and the last integrity run | integrity:admin |
| Event deliveries | Failed deliveries waiting, and deliveries running late | events:admin |
With the system check (Pro license, settings:write), the top of the page also shows how its latest run went, for example System check: 2 warnings · 14 minutes ago; select it to open the system check. The dashboard reads what is already known and never runs a test itself; the system check makes the deeper tests on every server.
7. Recently quarantined
The five versions quarantined most recently anywhere in the installation, with where they are, why (by hand, by a rule or by a guard) and when. Shown with Enterprise to whoever manages quarantine (artifacts:quarantine:manage); See all opens Settings → Quarantine.