GETTING STARTED
 UI Overview
A detailed walkthrough of every UI component in API Studio — modes, sidebar, tabs, request builder, response viewer, layout options, and shortcuts.
Simple Mode vs Advanced Mode
API Studio starts in Simple Mode — a clean, focused interface for everyday API testing. Toggle Advanced Mode in the settings menu to unlock the full feature set.
| Feature | Simple | Advanced |
|---|---|---|
| Top-level views | Requests only | Requests + Mock+MCP + Vault |
| Request tabs | Params, Headers, Body, Auth | + Tests, Scripts, MCP, Settings |
| Mock servers | Hidden | Full access |
| Secret vault | Locked | Full access |
| Collection editor tabs | Overview, Auth | + Scripts, Runs, MCP, Settings |
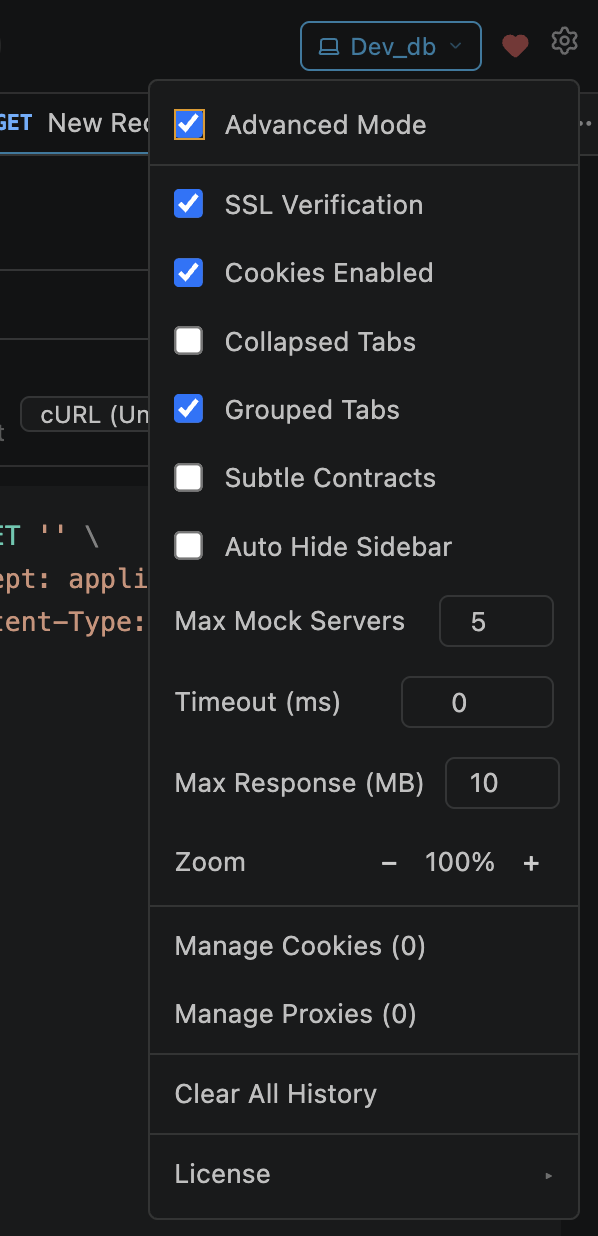
Settings → check "Advanced Mode"

Top bar after enabling Advanced Mode
Sidebar Tabs
The left sidebar has four tabs. Click a tab icon to switch between them. The sidebar is collapsible — drag the border or double-click to hide.
Collections
Saved requests organized in collections and nested folders. Drag-and-drop to reorder. Click a collection name to open its editor. Deep search by name or URL.
Environments
Local (workspace) and Global (shared) environments. Each has key-value variables. Select the active environment from the top-bar dropdown.
History
Every request you send is automatically logged. Browse past requests, click to re-open, or delete entries. Capped at 500 entries (configurable).
Snapshots
Response contract tracking. Automatically records response structures for saved requests. Notifies when an API returns a new shape (variant detection).
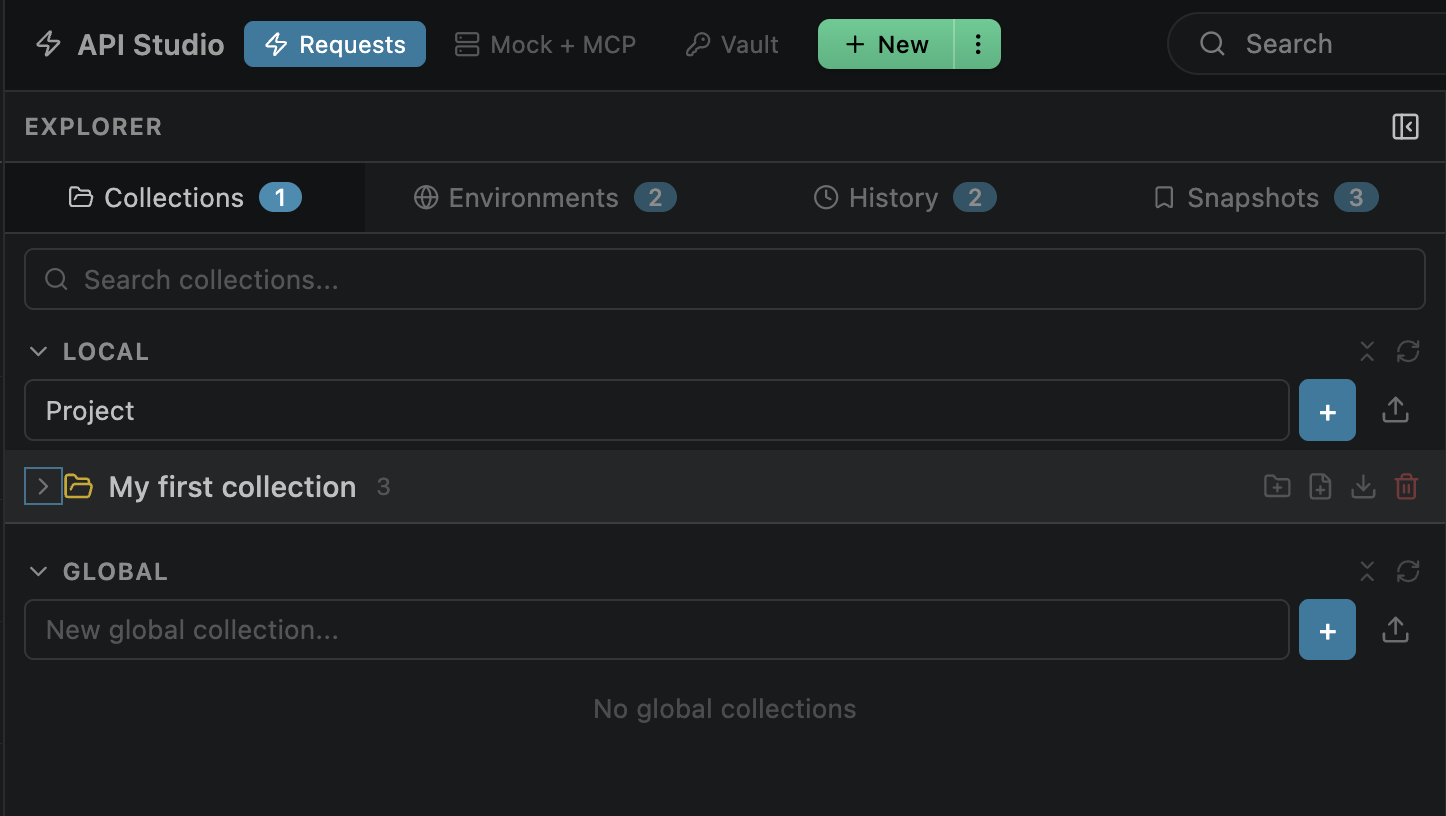
Collections tab
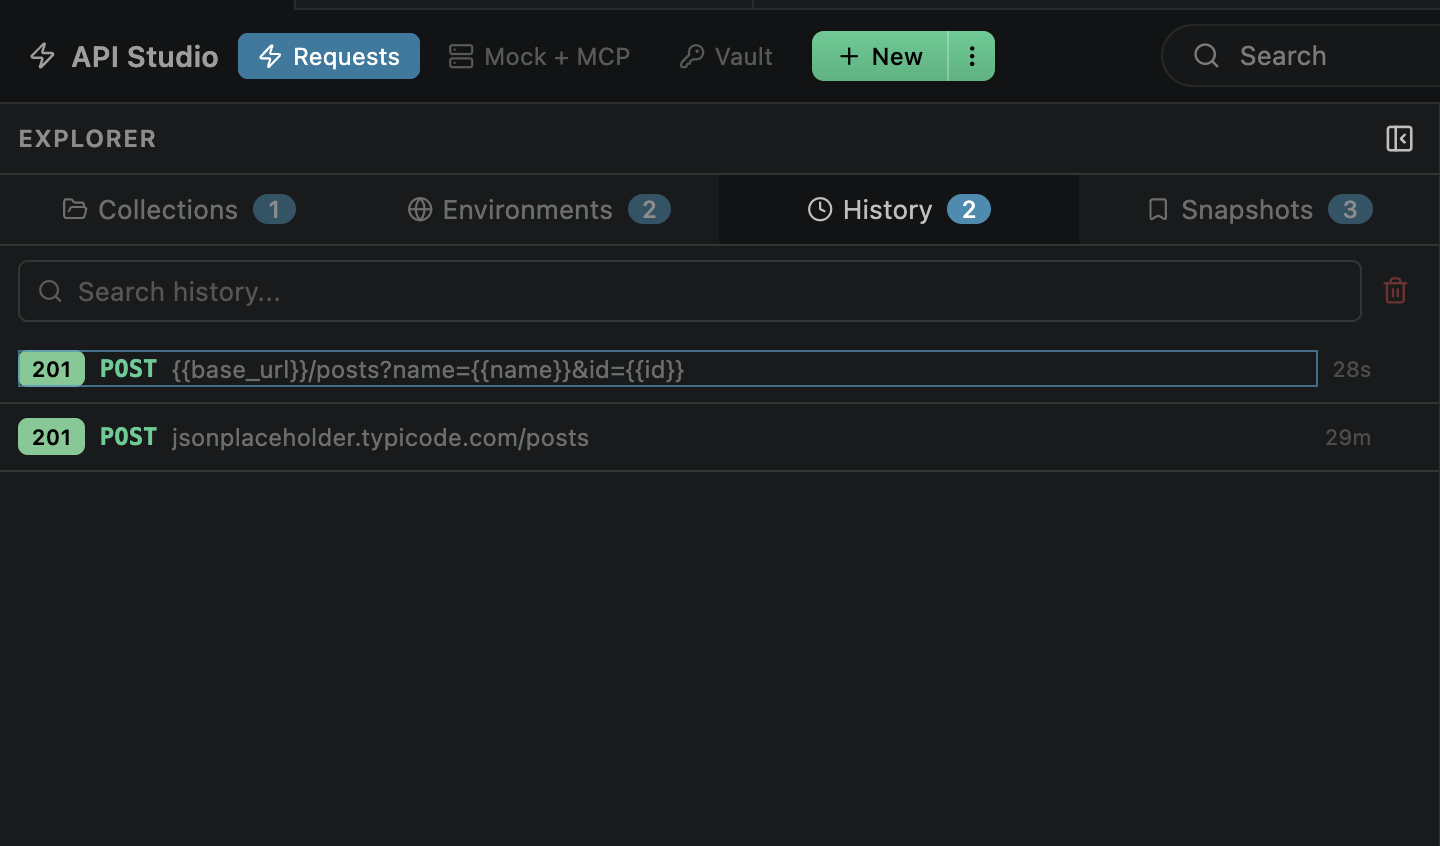
History tab
Tab Bar
Each request, collection editor, and folder editor opens in its own tab. Tabs persist across sessions — reopen VS Code and your tabs are still there.

Grouped tabs — one open, one collapsed
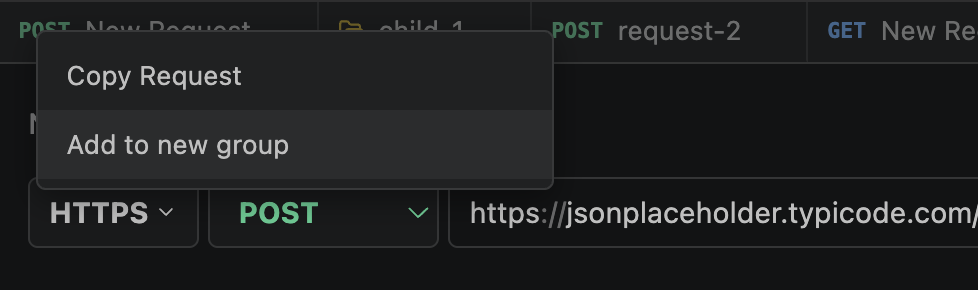
Right-click context menu
Request Builder Tabs
Below the URL bar are sub-tabs for configuring different parts of the request.
| Tab | Mode | Purpose |
|---|---|---|
| Params | Simple | Query parameters — synced bidirectionally with the URL bar |
| Headers | Simple | Custom request headers with autocomplete for standard HTTP headers |
| Body | Simple | Request body — JSON, form-data, urlencoded, raw, XML, GraphQL, binary |
| Auth | Simple | Authentication config — 7 types with inherit-from-parent option |
| Tests | Advanced | GUI test rules (assertions) and response variable extraction |
| Scripts | Advanced | Pre-request and test JavaScript in a sandboxed VM |
| MCP | Advanced | MCP tool description and input schema when exposed as AI tool |
| Settings | Advanced | Per-request proxy selection and TLS certificate configuration |
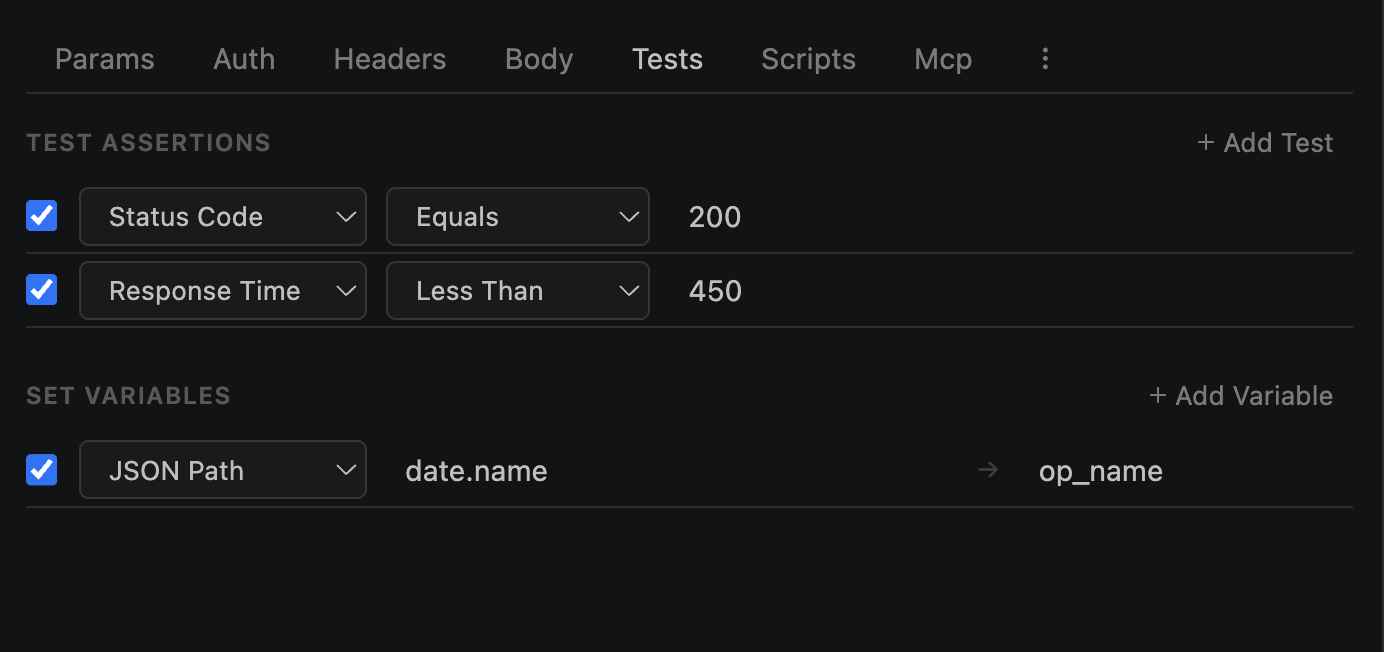
Tests tab showing GUI assertions and a set-variable extraction rule
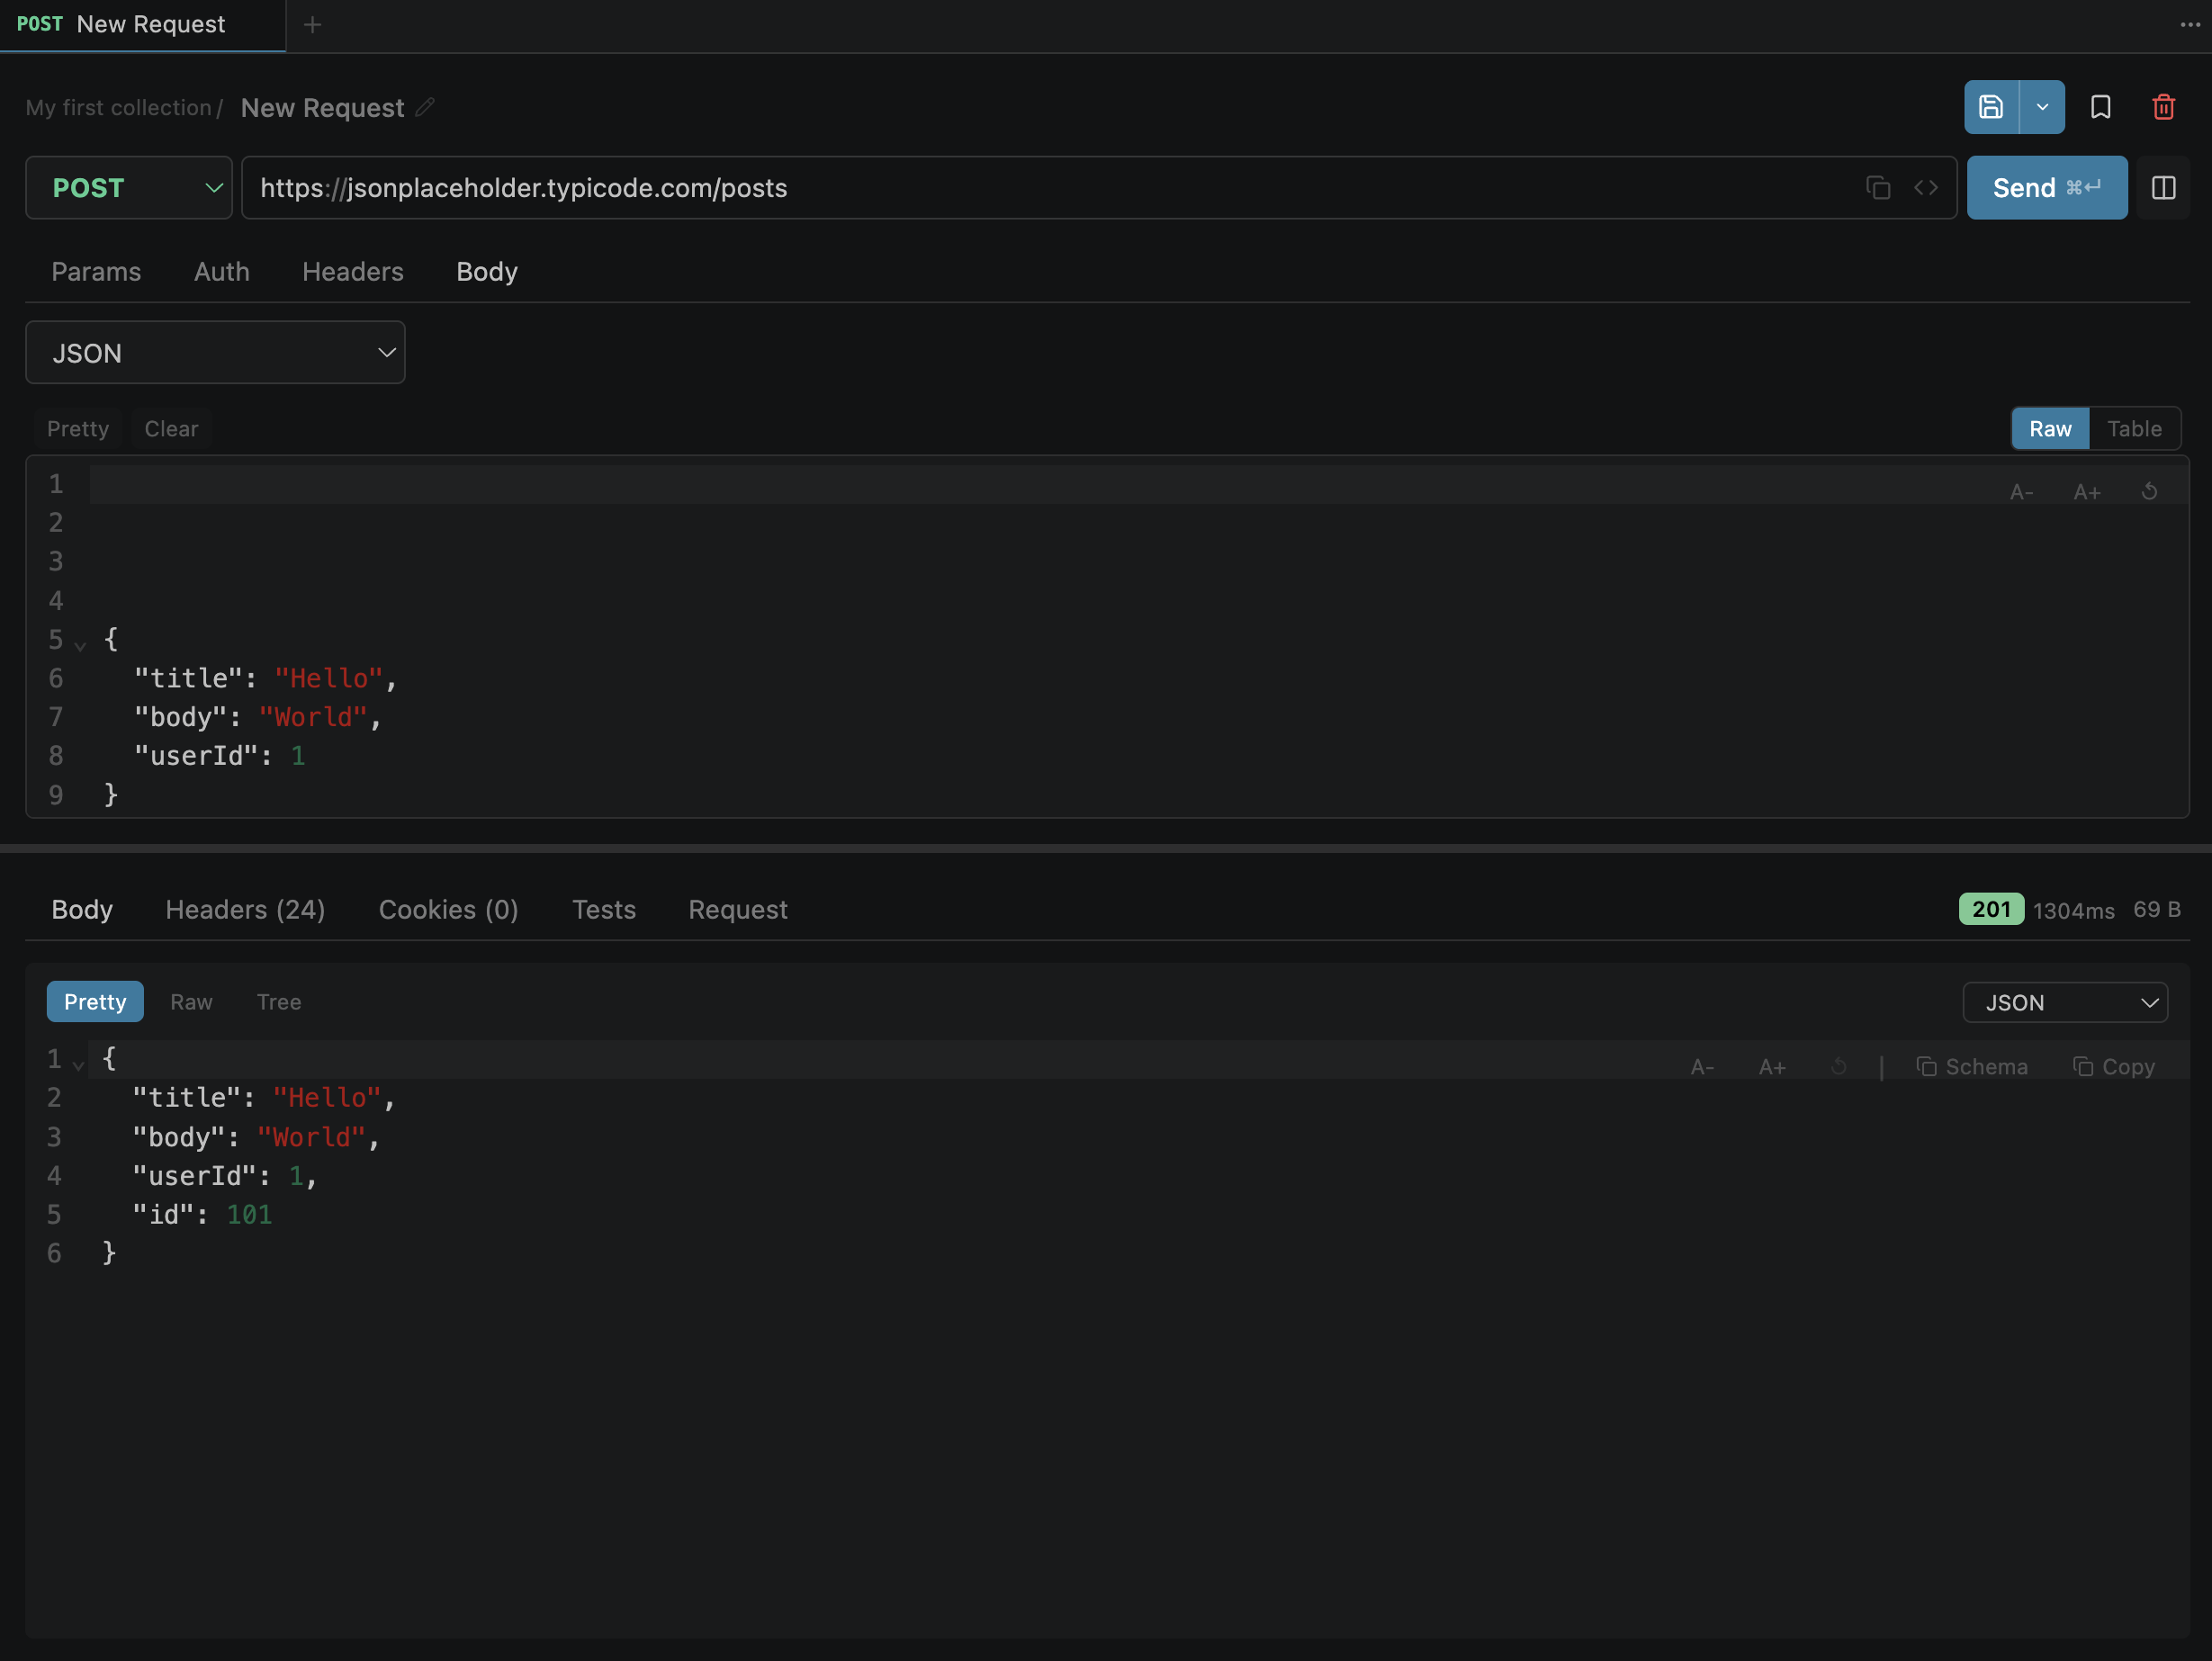
Response Viewer
The response area appears after sending a request. Available tabs depend on the response type:
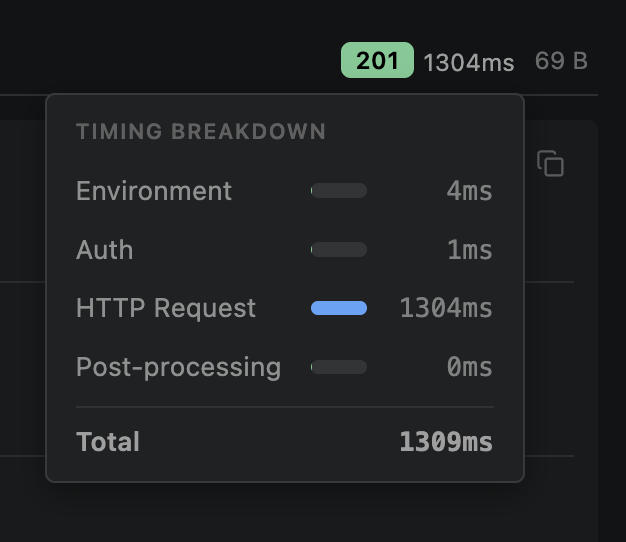
Click the response time to see the timing breakdown (DNS, TCP, TLS, TTFB, download)
Layout Options
Stacked view — request builder on top, response viewer below
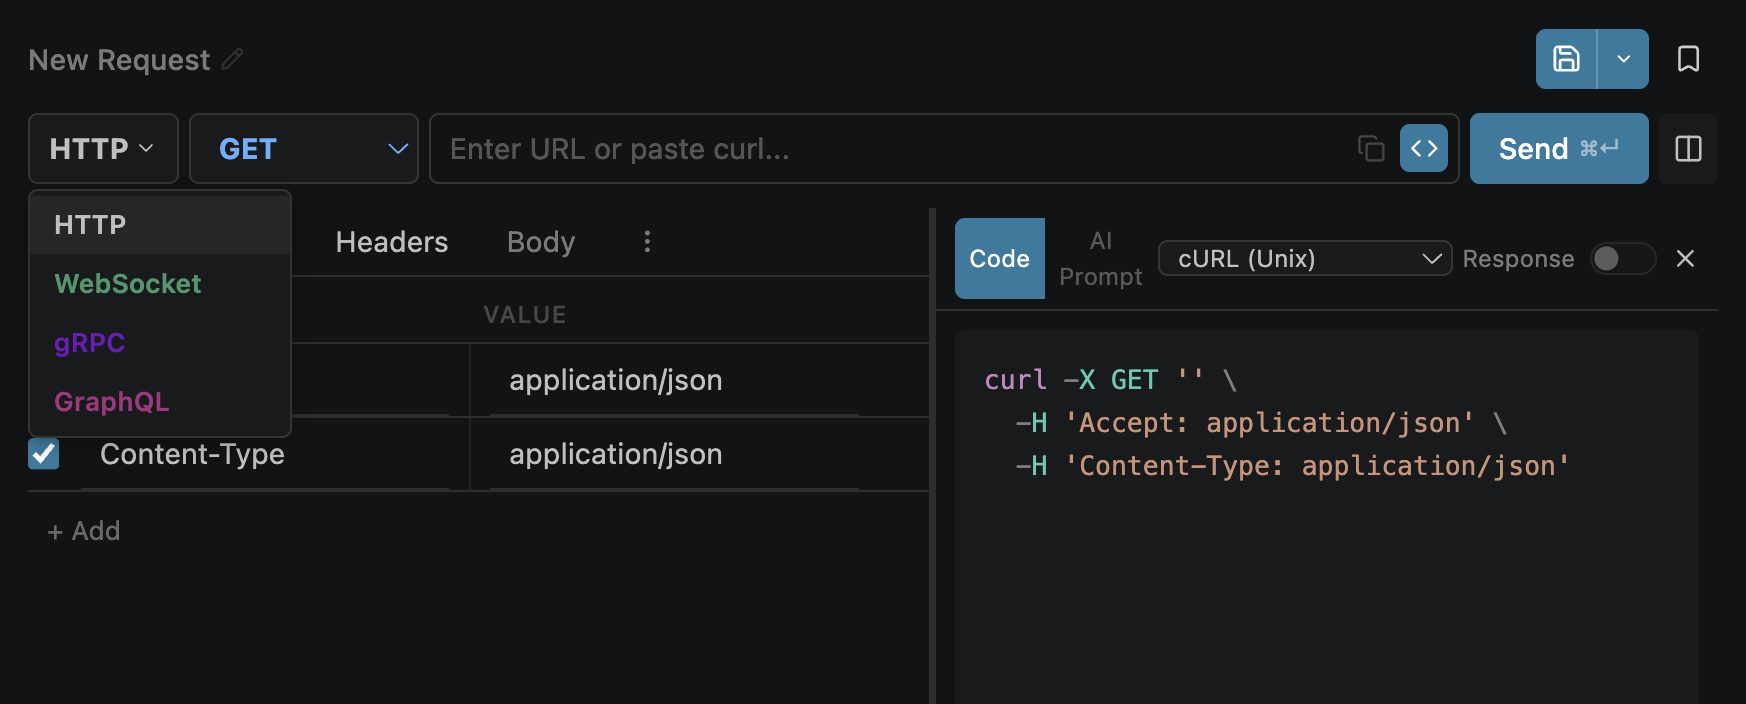
Protocol Selector
The dropdown left of the URL bar switches between protocols. Each protocol changes the available tabs and the action button:
| Protocol | Button | Tabs |
|---|---|---|
| HTTP | Send | All tabs, method selector visible |
| GraphQL | Send | Body (first), Headers, Auth, Tests, Scripts, Settings |
| WebSocket | Connect / Disconnect | Params, Headers, Auth only |
| gRPC | Invoke / Cancel | Metadata, Auth, Settings only |
Environment Dropdown
The top bar shows the active environment. Click to switch. Variables in the active environment resolve wherever you use {{variable}} syntax.
.openpost/)~/.openpost/global/){{variable}} in the URL to see its resolved value and source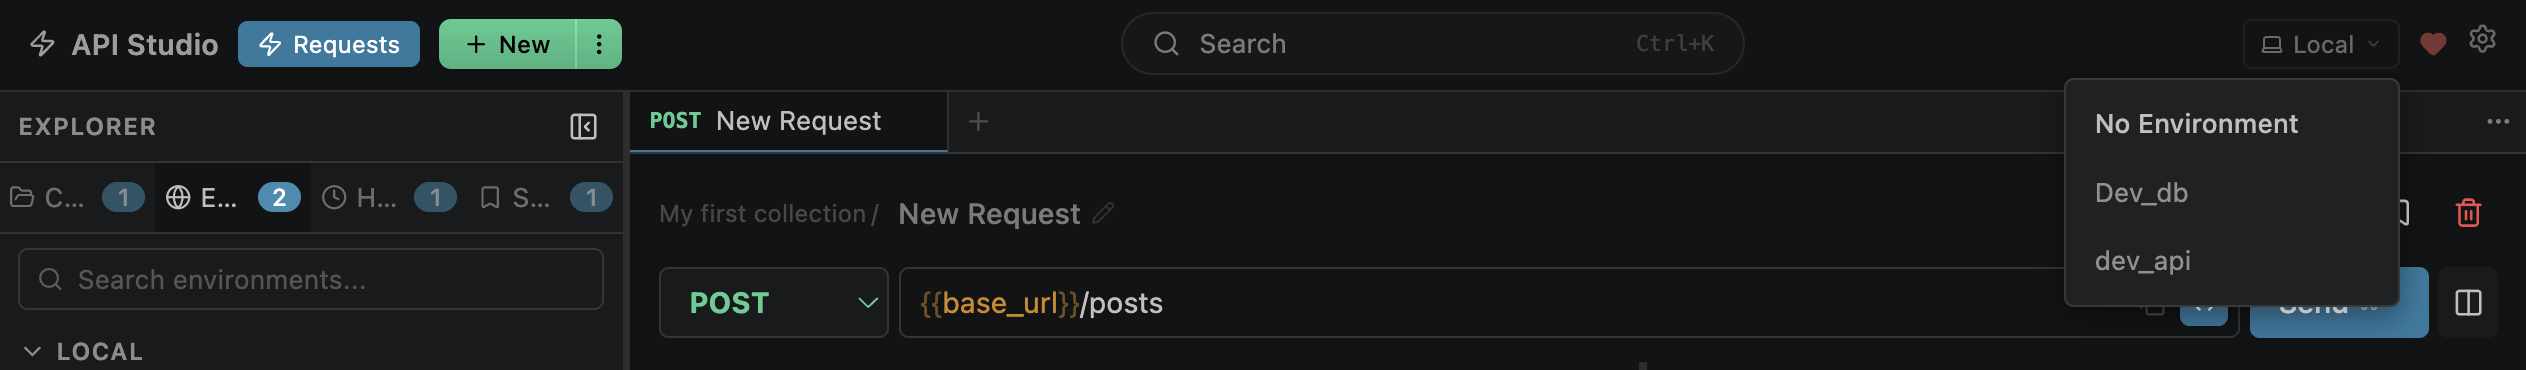
Keyboard Shortcuts
| Action | macOS | Windows / Linux |
|---|---|---|
| Open API Studio | Cmd+Alt+P | Ctrl+Alt+P |
| Send Request | Cmd+Enter | Ctrl+Enter |
| Save Request | Cmd+S | Ctrl+S |
| New Request Tab | Cmd+T | Ctrl+T |
| Close Tab | Cmd+W | Ctrl+W |
| Search in Response | Cmd+F | Ctrl+F |